

Share of voice is the slice of category conversation, coverage, or ad presence that belongs to your brand. Share of market is the slice of category sales that belongs to your brand. The first is an input you can move this month. The second is the outcome your board judges you on, and it usually moves a year later. We treat the gap between the two as the most useful forecasting number in brand measurement, because decades of effectiveness data say a brand whose voice runs ahead of its market share tends to grow into that gap. This guide compares the two metrics side by side, shows how to calculate share of market when nobody hands you a clean number, and walks through the quadrant model we use to decide what to do with the gap.
- Share of voice is a leading input; share of market is a lagging outcome. They share a formula shape (your number over the category total) and almost nothing else.
- Ten points of excess share of voice bought about half a point of extra market share a year across 123 brands in 30 categories (Nielsen ESOV analysis).
- The rule is stronger in B2B than most teams assume. Ten points of ESOV drove 0.7 points of annual share growth in B2B against 0.6 in B2C (LinkedIn B2B Institute).
- Where you sit on a two by two of voice against market is the actual planning tool. A challenger above the diagonal and a leader below it need opposite budget decisions, even when their SOV looks similar.
- Share of search is a fast third metric that sits between the two, and it led market share by up to a year in the car category (IPA, 2020).
- What is the difference between share of voice and share of market?
- How to calculate share of market when nobody hands you the number
- Which share of voice belongs in the comparison
- How the two connect: excess share of voice
- The four quadrants of voice against market
- Does the rule still hold in a digital and AI search world?
- A worked example across four quarters
- Mistakes we see when teams compare the two
- Frequently asked questions
What is the difference between share of voice and share of market?
Short answer: share of voice (SOV) measures your portion of the attention in a category, counted as ad spend, mentions, impressions, or search visibility. Share of market (SOM) measures your portion of the purchases in that category, counted as revenue, units, or customers. SOV is something marketing controls directly and can change inside a quarter. SOM is the result of everything the company does, from pricing to product to sales coverage, and it moves slowly.
Both use the same arithmetic, your figure divided by the category total, times 100. That shared shape is the reason they get confused in reporting decks. Put them next to each other on every dimension that matters for decisions and the overlap shrinks fast.
| Dimension | Share of voice | Share of market |
|---|---|---|
| What it counts | Ad spend, mentions, impressions, rankings, AI citations | Revenue, units sold, or customers |
| Signal type | Leading indicator | Lagging outcome |
| Who controls it | Marketing, PR, and comms | The whole business |
| How fast it moves | Days to weeks | Quarters to years |
| Typical data source | Listening tools, ad platforms, SEO suites | Analyst reports, filings, panel data, CRM |
| Reporting cadence | Weekly or monthly | Quarterly or annually |
If you only remember one row, make it the signal type: voice points to where share is heading, and market confirms where it landed, usually a year later.
How to calculate share of market when nobody hands you the number
The formula is easy: your sales in the category divided by total category sales, times 100. A brand with $12 million in revenue in a $150 million category holds an 8% revenue share. The hard part sits in the denominator, and in B2B software it is often missing entirely, because private competitors do not publish revenue and analyst sizing reports disagree with each other by wide margins.
We work through three versions, in order of how much we trust them:
- Revenue share from published data. Use this when the category has public companies or a syndicated panel (Nielsen, Circana, IDC). It is the cleanest version and the one finance will accept without a follow up meeting.
- Customer or unit share. Useful when revenue is hidden but customer counts leak through case study pages, G2 review volume, or job postings that mention a tool. Expect noise. Treat it as a range, never a point estimate.
- Competitive win share from your own CRM. Count the deals where a named competitor was in the evaluation and divide your wins by all decided deals. It only covers the slice of the market you already reach, which makes it a narrow proxy, but it updates every month and nobody can argue with where the data came from.
Whichever version you pick, lock the category definition before you start. The competitor set you use for the market denominator has to match the set you use for voice, or the comparison later in this guide falls apart. Our competitor analysis template is a reasonable place to settle that list once and reuse it for both metrics.
Which share of voice belongs in the comparison
Share of voice started as a paid media number: your ad spend as a share of category ad spend. Most of the research linking voice to market share was built on that definition, a detail that gets lost when someone brings a social mention count to the same conversation.
Today a brand can measure at least five versions of SOV, and each one answers a slightly different question. Paid SOV tells you whether you are outspending the category, while earned mention SOV, pulled from social media monitoring and press coverage, tells you whether people talk about you more than your size would predict. Search and AI citation SOV cover a third question: whether you get found when a buyer starts looking. We cover the formula for each channel in our guide on calculating share of voice, so we will skip the arithmetic here.
For a comparison against market share, our default play is to track paid SOV and earned SOV as two separate lines. Paid SOV maps directly onto the published benchmarks. Earned SOV is the version listening data gives you for free, and in our experience it tends to move a few weeks ahead of paid, because a launch or a controversy shows up in conversation before it shows up in a media plan. Blend the two into one figure and you lose the ability to tell which one is doing the work.
How the two connect: excess share of voice
Excess share of voice (ESOV) is your share of voice minus your share of market. A brand with 25% SOV and 15% SOM has an ESOV of +10. A brand with 12% SOV and 20% SOM sits at minus 8. The sign of that number is the forecast.
The best known benchmark comes from a Nielsen study of 123 brands across 30 categories, which found that on average a 10 point gap between SOV and SOM produced 0.5 points of extra share per year (Nielsen). The average hides a big split. Brand leaders gained 1.4 points of share per 10 points of ESOV, while challenger brands gained only 0.4, so a challenger has to be roughly three and a half times as effective with its spend to keep pace with the leader.
B2B teams sometimes assume the rule is a consumer goods artifact. The data says otherwise. When the LinkedIn B2B Institute worked with Les Binet and Peter Field on the IPA effectiveness databank, they found 10 points of ESOV drove 0.7 points of annual growth in B2B markets, slightly higher than the 0.6 points seen in B2C (LinkedIn B2B Institute).
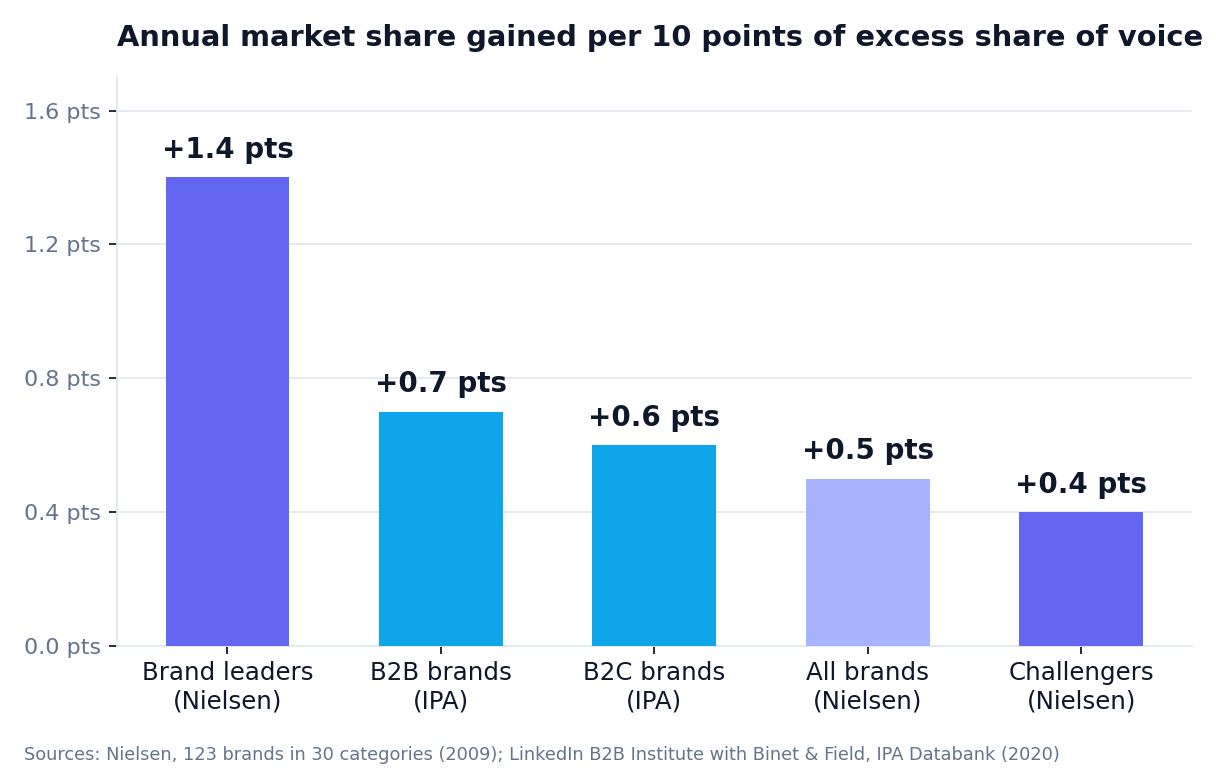
Two caveats before anyone builds a budget on these figures. They describe averages over a year, so a single quarter of high voice will not show up in share. They were also measured mostly on paid media, which means an earned mention ESOV is a directional proxy at best (useful, just less proven).
Ten points of excess voice is worth about half a point of market share a year. Small on a slide, large on a revenue line in any category worth competing in.
The four quadrants of voice against market
Plot every brand in the category with SOM on the horizontal axis and SOV on the vertical, then draw a diagonal where the two are equal. Anything above the line is speaking louder than its size; anything below it is coasting on reputation. Split the chart again at the category median share and you get four positions, each with a different default move.
| Position | What it usually means | Default move |
|---|---|---|
| Small share, high voice | Challenger buying growth | Hold the gap for at least four quarters, then check share |
| Large share, high voice | Leader defending and extending | Keep ESOV slightly positive; leaders get the best return per point |
| Large share, low voice | Harvesting, often without realizing it | Flag the decline risk before share starts to slip |
| Small share, low voice | Niche player or a brand losing relevance | Pick one channel and concentrate voice there |
The quadrant we worry about most is the third one. A large brand that quietly cut its budget two years ago still looks healthy on revenue, because share lags. By the time the market number turns, the voice deficit has been compounding for several reporting cycles and the fix costs far more than the cut saved.
Building this chart by hand for six competitors takes most of an afternoon. Pulling the voice side from competitor tracking data cuts that to minutes, and leaves the market side as the only number you have to source manually each quarter.
Does the rule still hold in a digital and AI search world?
A fair question, since most of the benchmark data predates TikTok, programmatic buying, and AI answer engines. Binet and Field tested it directly in their 2017 IPA report Media in Focus. Across the IPA databank, ESOV explained 12% of annual share growth in 2008 to 2016, double the 6% it explained in 1998 to 2006, while the efficiency held steady at 0.6 share points per 10 points of ESOV (IPA, Media in Focus). The link got tighter in the digital era, the opposite of what most of the industry expected.
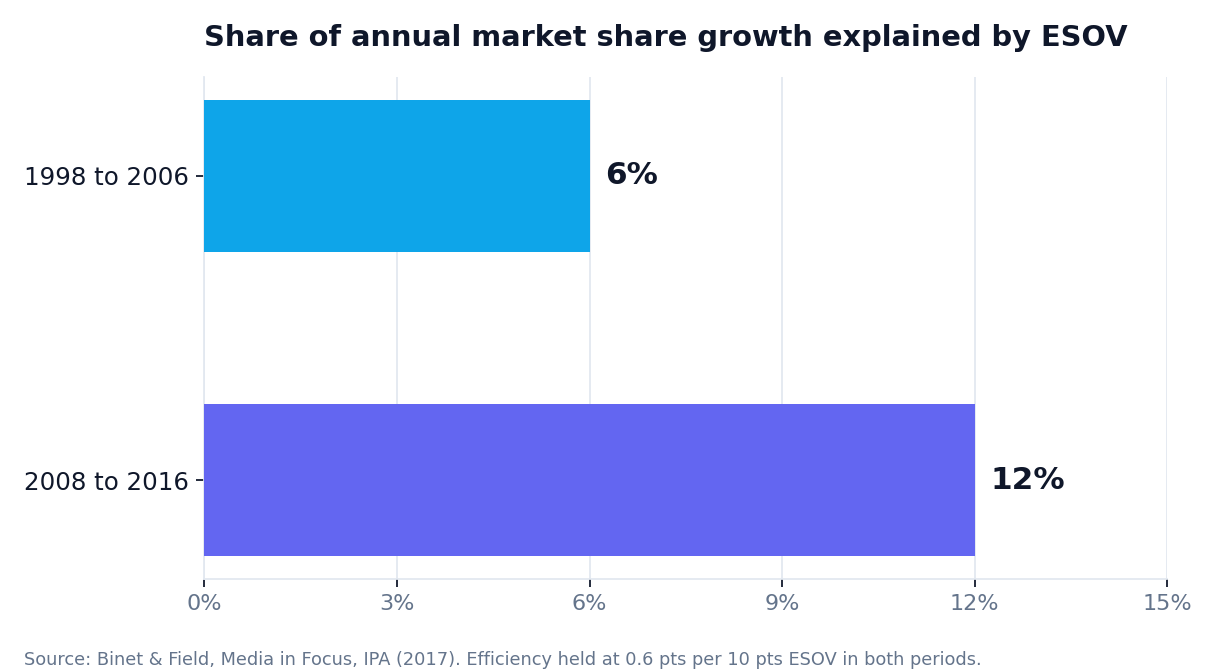
Twelve percent sounds modest. It is also one variable, out of hundreds that affect share, explaining an eighth of the movement on its own, which is a lot for a number a marketing team controls directly.
Search has added a third metric that sits between voice and market. Les Binet introduced share of search at EffWorks Global in October 2020: your brand's organic search volume divided by the search volume for all brands in the category. In the automotive, energy, and mobile handset categories he tested, share of search correlated with market share, and for cars it led market share by up to a year (IPA). Google Trends gives you the inputs for free, which makes it the cheapest early warning signal in this whole guide.
AI answer engines are the newest layer, and the least measured. When a buyer asks ChatGPT or Perplexity for the best tools in a category, the brands named in that answer are capturing voice at the exact moment of consideration. Nobody has published a long run study linking AI citation share to market share yet (we would treat any claim of one with caution). We still track it, using AI visibility monitoring, because a brand absent from those answers is starting the buyer's shortlist from behind. A free AI technical audit shows whether your site is even readable to those engines before you worry about citation share.
A worked example across four quarters
The numbers below are illustrative, built to show the mechanics, and modeled on the kind of mid market SaaS category we see most often. Five vendors compete in a $150 million segment. Our example brand books $12 million in annual revenue, an 8% share of market.
On the voice side, the team pulls earned mentions for all five vendors every month and paid impression share from its ad platforms. Over four quarters the averages come out like this: earned SOV of 14%, paid SOV of 11%. Against an 8% market share, that is an earned ESOV of +6 and a paid ESOV of +3.
Now apply the benchmarks with appropriate humility. Using the B2B figure of 0.7 points per 10 points of ESOV on the paid line, +3 ESOV suggests roughly 0.2 points of share growth over the next year. Small. On a $150 million segment it is about $300,000 in revenue, which is still more than many teams would guess from looking at a mention chart. Because this brand is a challenger, the Nielsen split suggests the realistic return is lower, closer to the 0.4 points per 10 benchmark, so we would book it at about 0.12 points and call the range $180,000 to $300,000.
The earned line is where the more interesting signal sits. An earned ESOV of +6 says buyers are talking about this brand more than its size would predict. That usually comes from something specific (a product launch, a strong review profile, a founder with an audience), and the follow up question for the team is whether paid spend should rise to meet it while the conversation is warm.
Teams at an early stage can run the same model with win share from the CRM in place of revenue share. SaaS startups rarely have a trustworthy category size, and win share against named competitors is a perfectly usable stand in until they do.
Mistakes we see when teams compare the two
Mismatched category definitions. The voice denominator includes eight competitors pulled from a listening tool, while the market denominator comes from an analyst report covering twenty. The resulting ESOV is meaningless. Use one competitor list for both, written down and versioned.
Reading a quarter as a trend. Market share moves on an annual rhythm. Comparing one strong month of voice against last quarter's share, then declaring the rule broken when share does not budge, is the single most common misuse we run into.
Counting all mentions as voice. A spike driven by a product outage inflates SOV while doing nothing good for future share. Weight or filter earned voice by sentiment before you compare it to anything; our guide on measuring brand sentiment covers a practical way to do that.
Treating SOV as the goal. Voice is a means. If the board report celebrates a rising SOV for six quarters without a word on share, somebody will eventually ask what it bought, and that conversation is far easier with the quadrant chart already in hand.
Frequently asked questions
Is share of voice the same as market share?
No. Share of voice measures your portion of category attention, such as ad spend or mentions, and share of market measures your portion of category sales. Voice is a leading signal, market is the outcome. The two are linked, and Nielsen found 10 points of excess voice added about half a point of share a year, but a brand can hold very different positions on each.
What is a good excess share of voice?
Any positive number is a growth position. Most growth plans we build target +5 to +10 points.
Can we use social mentions instead of ad spend to calculate ESOV?
You can, as long as you label it clearly as earned ESOV and keep it separate from paid ESOV. The published benchmarks, including the 0.5 point Nielsen average and the 0.7 point B2B figure from the LinkedIn B2B Institute, were built mostly on paid media, so earned mention ESOV does not have an equivalent conversion rate yet. We find it useful as an early read on momentum, especially in categories where competitors spend very little on paid media and most of the conversation happens on Reddit, review sites, and in trade press. Just do not plug an earned figure into the paid benchmark and present the output as a forecast.
How often should we compare share of voice with share of market?
Track voice monthly and compare it against market share quarterly, with a full review once a year. Share moves slowly enough that monthly comparisons mostly produce noise. The IPA research on share of search found a lead of up to a year in the car category, so a twelve month lookback on voice is a reasonable window for judging whether a gap turned into growth.
Why does a market leader get more share growth from the same ESOV?
Leaders benefit from scale effects that challengers do not have. Their ads are recognized faster, more buyers already have a memory structure for the brand, and distribution is wider, so each point of attention converts more easily into a sale. Nielsen measured the gap at 1.4 share points per 10 points of ESOV for leaders against 0.4 for challengers. For a challenger this is a reason to concentrate voice in one channel or segment where it can reach a leader's level of salience, instead of spreading a smaller budget thinly across every channel and getting the weakest return on all of them.
Voice and market answer two different questions, and the useful number lives in the gap between them. Most of the work is upfront: one agreed competitor list, and a market figure you can defend in front of finance. After that, the quarterly chart takes an hour. If your brand sits below the diagonal when you plot it, raise it with finance this quarter, before the market number raises it for you.
Track the voice side automatically
Mentient pulls mentions for your brand and every named competitor across social, news, Reddit, reviews, and AI answers, so your share of voice is ready the moment you need to compare it against market share.
Start free trial