Most social listening dashboards show you forty metrics and tell you nothing. Mentions went up. Engagement went down. Sentiment is "72% positive." None of that tells you whether to act, and most of it is noise dressed up as signal.
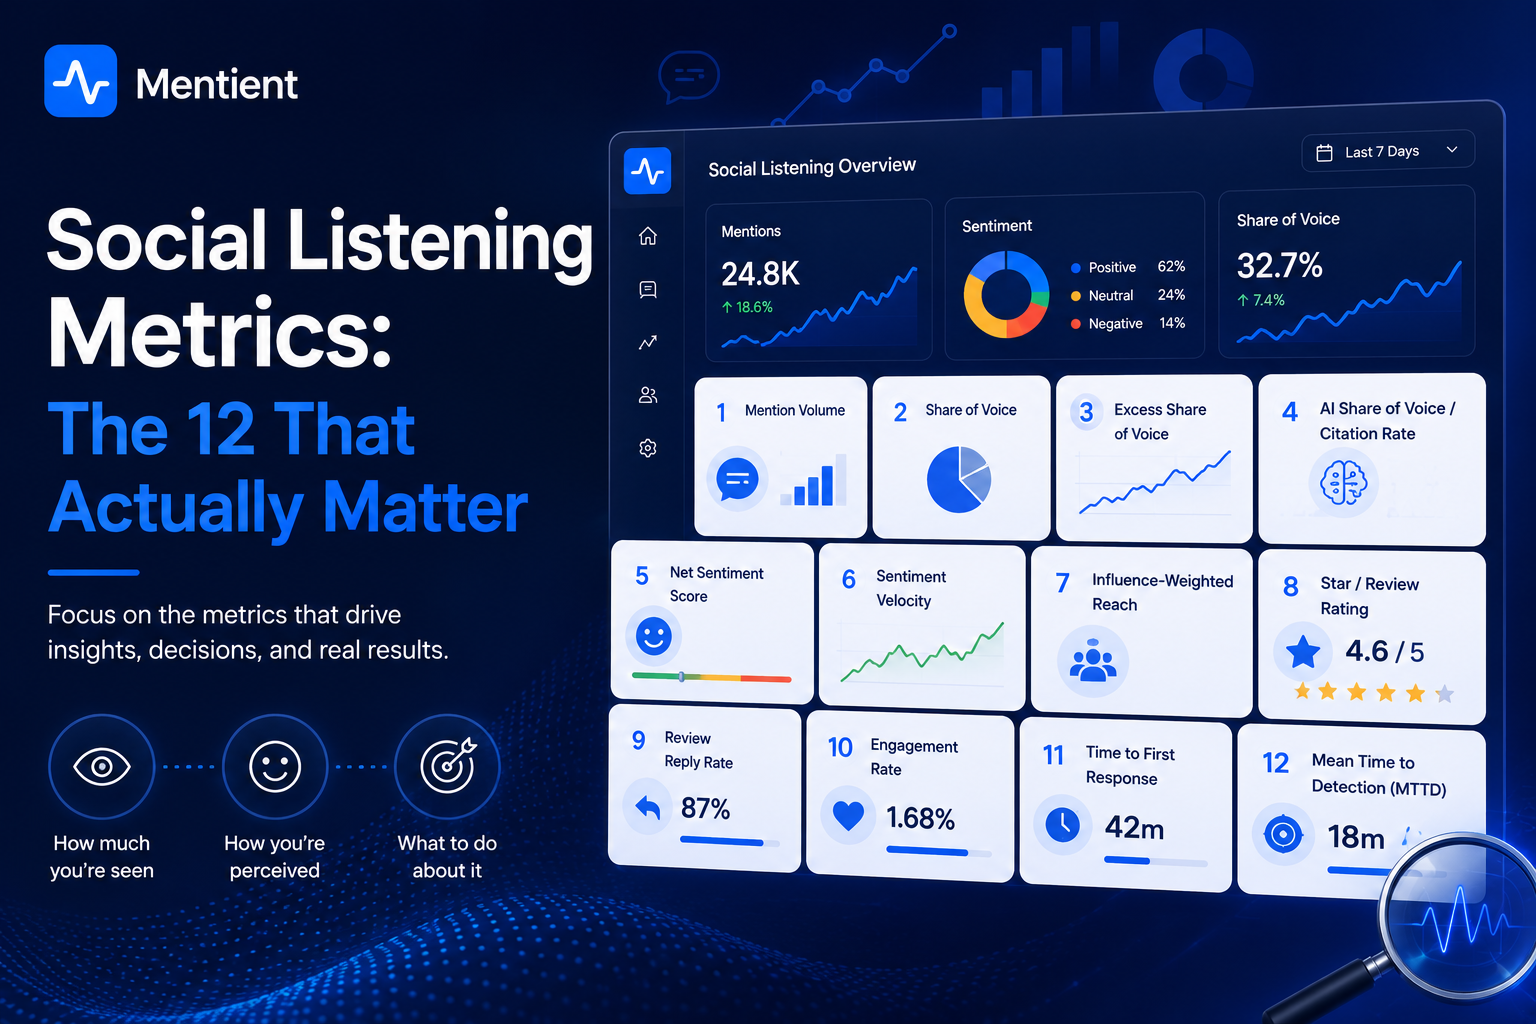
We pulled together the research on which social listening metrics actually predict something, whether that is market share, revenue, or a crisis you can still contain. Some of what we found contradicts the way most teams report this data today. Here are the 12 metrics worth your attention, grouped by what they actually tell you: how much you're seen, how you're perceived, and what to do about it.
Key takeaways
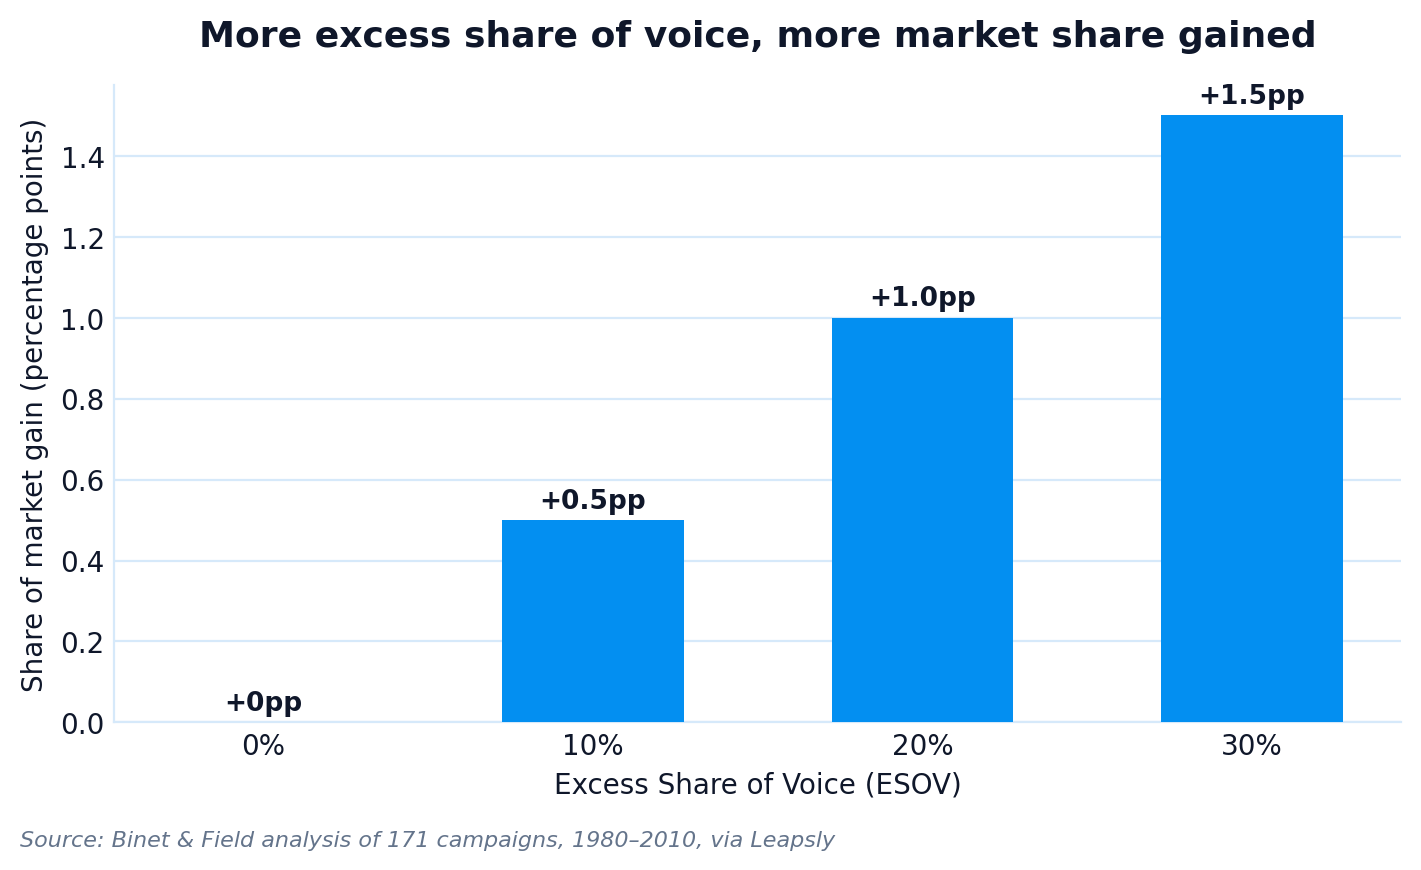
- Share of voice is a leading indicator, not a vanity number. Binet and Field's analysis of 171 ad campaigns from 1980 to 2010 found that a brand's share of market rose roughly 0.5% for every 10 points of Excess Share of Voice, via Leapsly's summary of the research.
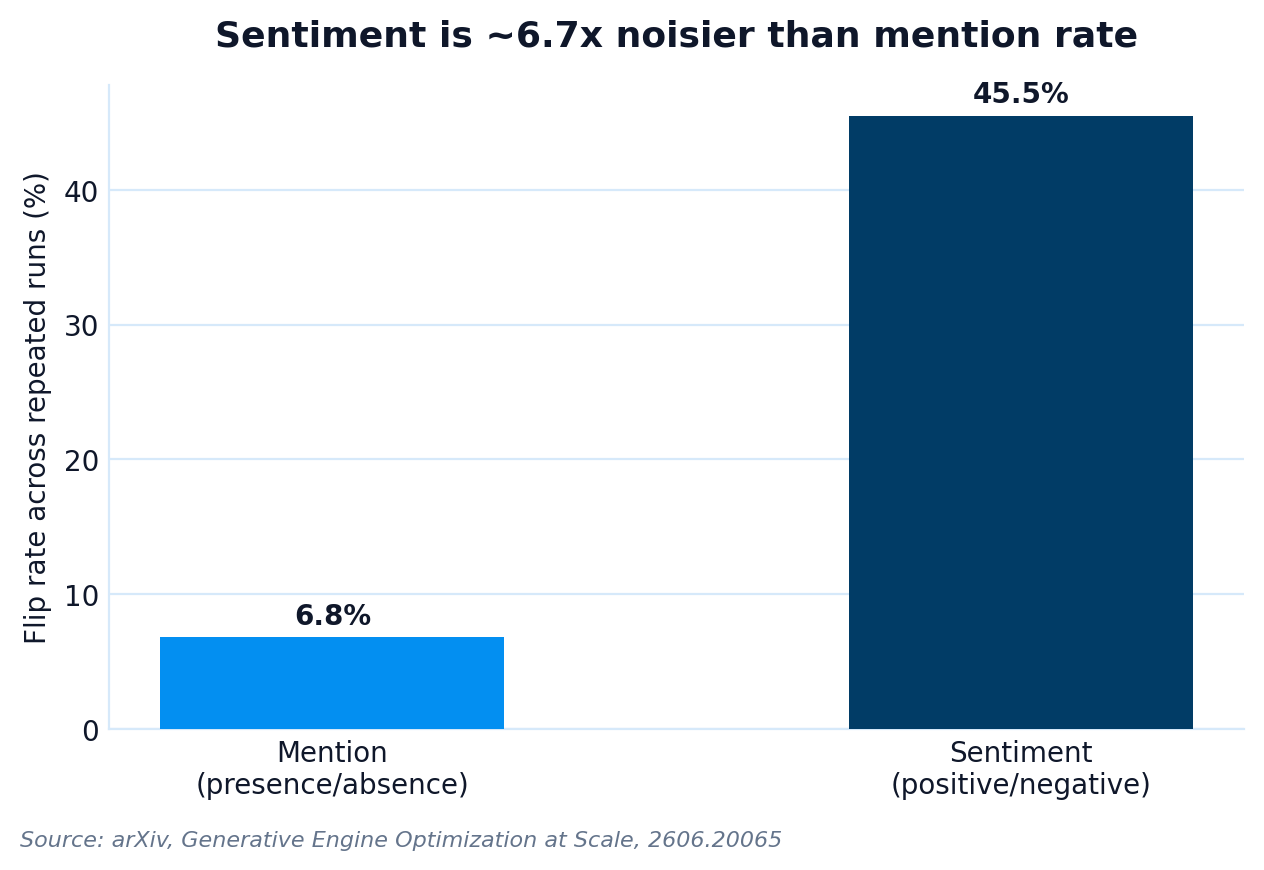
- Sentiment is far noisier than raw mention counts. An arXiv study of AI brand visibility found sentiment classifications flip between positive and negative 45.5% of the time across repeated runs, making it roughly 6.7 times noisier than mention rate at the same sample size.
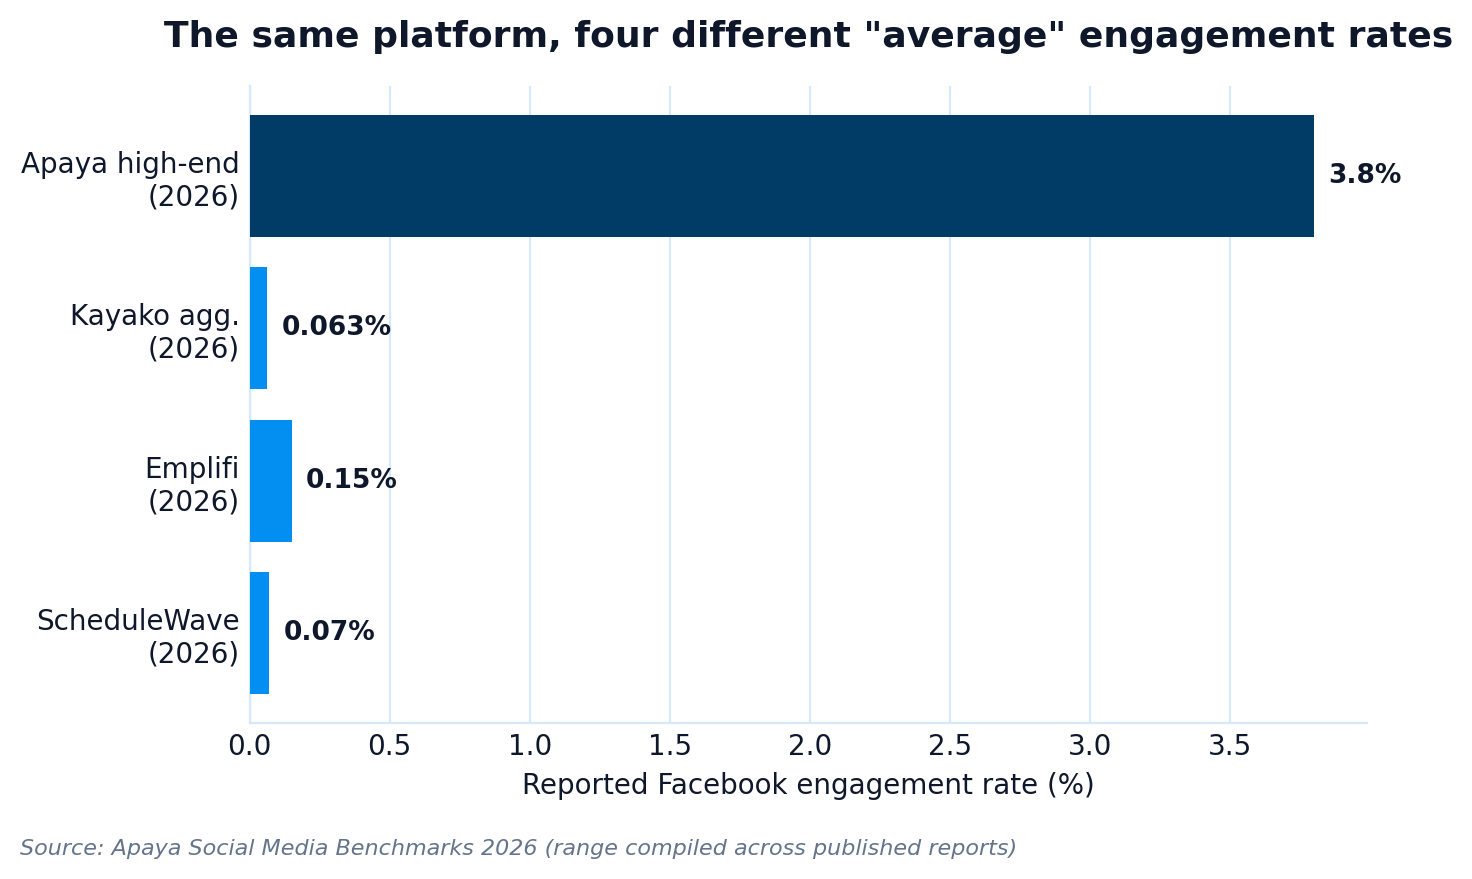
- Engagement rate benchmarks disagree so badly across published reports that the same platform, Facebook, shows rates ranging from 0.063% to 3.8%, a 60x spread, depending on whose formula and dataset you trust.
- A one-star increase in review rating causes a 5-9% increase in revenue, according to Harvard Business School's regression-discontinuity analysis of Yelp and Washington State tax revenue data.
- Crisis response has a real clock attached to it. Industry benchmarks put the gold standard at detection within 5 minutes and initial response within 60 minutes, and delayed responders retain a small fraction of their audience's trust.
In this article
- Why most listening dashboards mislead you
- Visibility metrics: how much you're seen
- Perception metrics: how you're seen
- Action metrics: what to do about it
- Putting it together: a simple weekly scorecard
- FAQ
Why most listening dashboards mislead you
The core problem with most social listening reporting is that it treats every metric as equally reliable and equally actionable. It isn't. Mention volume moves for reasons that have nothing to do with brand health: a competitor's product recall, a seasonal spike, a meme that happens to include your name. Sentiment scores swing with the mood of whoever posted that day, and as the data below shows, sentiment is inherently a noisier signal than volume. Engagement rate is calculated differently by nearly every tool that reports it, so a "good" engagement rate on one platform's benchmark report can be a mediocre one on another's.
None of that means these metrics are useless. It means they need context: a baseline to compare against, a rate of change instead of a snapshot, and a formula you actually understand before you trust the number. The 12 metrics below are the ones with research behind them showing they predict something real, organized into three groups.
Visibility metrics: how much you're seen
1. Mention volume (relative to baseline)
Raw mention count on its own tells you almost nothing. The number that matters is how today's volume compares to your rolling baseline, typically a 7-day average. Crisis-monitoring frameworks generally set a yellow alert at 3x the baseline and a red alert at 5x, measured over a 2-hour window, according to guidance from Puntt's brand monitoring research. Track the multiple, not the count.
2. Share of voice (SOV)
Share of voice is your brand's mentions, impressions, or citations as a percentage of the total conversation in your category. It matters because of what it predicts, not just what it describes. Nielsen and Millward Brown research, cited across multiple industry analyses including Leapsly's SOV guide, found that brands with SOV higher than their market share tend to grow that share over time, while brands with lower SOV tend to lose it. Millward Brown's own study spanned more than 4,000 brands across 28 countries.
3. Excess share of voice (ESOV) vs. share of market
This is the sharper version of the SOV story. ESOV measures the gap between your share of voice and your share of market. The most cited study here, by Les Binet and Peter Field, analyzed 171 campaigns across major categories from 1980 to 2010 and found that a brand's share of market rose approximately 0.5 percentage points for every 10 points of positive ESOV. That is a small, real, and repeatable number, not a rounding artifact. It also means the reverse is true: a brand under-spending its fair share of category conversation should expect to lose ground, not just stay flat.
4. AI share of voice / citation rate
This is the newest metric on the list and arguably the least stable. AI share of voice measures how often, and how prominently, your brand is mentioned or cited when people ask ChatGPT, Perplexity, Gemini, or Google's AI Overviews questions in your category. The instability is the finding worth internalizing: an analysis by Digital Applied found the same brand, on the same underlying data, scored 20% on a mention-based formula, 16.8% on a position-weighted formula, and 31.4% on a citation-based formula. Cited domain sets also drift 40-60% month over month in active categories. Track this metric, but treat any single reading as directional, not a verdict, and disclose which formula you're using when you report it.
Perception metrics: how you're seen
5. Net sentiment score
Net sentiment (positive mentions minus negative, as a share of total) is useful, but it deserves less confidence than most reports imply. Modern transformer-based models reach 85-95% polarity accuracy on benchmark datasets, per Sprinklr's published benchmarks summarized by LLMrefs, well ahead of the 60-75% accuracy of older lexicon-based scoring. That's real progress, but it's still not ground truth, and sarcasm, mixed sentiment, and slang remain the most common failure points. Use sentiment to prioritize what a human reviews, not as a number you report to the board without qualification.
6. Sentiment velocity (rate of change)
The absolute sentiment score matters less than how fast it's moving. A single-day drop of 10 percentage points or more in positive sentiment is generally treated as an early warning sign, per Sprout Social's guidance on AI sentiment tracking. This matters more than it sounds, because sentiment is inherently a volatile signal: the arXiv study on AI brand visibility referenced above found sentiment classifications flip between runs at a 45.5% rate versus 6.8% for mention presence, meaning sentiment needs a larger sample before you trust a single reading, but the direction of a sustained multi-day trend is still meaningful.
7. Influence-weighted reach
Not all mentions are worth the same. Ten mentions from high-reach, high-credibility accounts can carry more weight than a thousand mentions from low-visibility ones, a pattern documented across PR and influencer measurement research, including Brand24's analysis of listening metrics. This also shows up in influencer selection: micro-influencers with 10,000 to 100,000 followers frequently generate meaningfully higher engagement rates than macro-influencers or celebrity accounts, so a reach-weighted view of who's talking about you often points toward different partnerships than a follower-count view would.
8. Star / review rating
This is the one metric on this list with a clean causal study behind it, not just a correlation. Harvard Business School's Michael Luca used a regression-discontinuity design on Yelp ratings and Washington State's tax-filed restaurant revenue data (not surveys) and found that a one-star rating increase caused a 5-9% increase in revenue, an effect concentrated in independent businesses rather than chains. It's rare to get a controlled, causal number in brand measurement. This is one of them.
Action metrics: what to do about it
9. Review reply rate
Whether you reply to reviews is itself a measurable, controllable metric with a revenue signal attached. Analysis of transactions and review data across more than 200,000 U.S. businesses, from Womply and reported via MediaPost, found businesses replying to more than 20% of their reviews earned 33% more revenue than average, while businesses that never replied earned 9% less. Unlike sentiment or rating itself, reply rate is a metric your team fully controls week to week.
10. Engagement rate (with a formula caveat)
Engagement rate is worth tracking, but only against your own historical baseline, not against a published industry benchmark. The disagreement across benchmark reports is not a rounding error: published Facebook engagement rate averages for 2026 range from 0.063% to 3.8%, according to Apaya's benchmark comparison, a 60x gap explained entirely by differing formulas (rate by followers vs. by reach vs. by impressions) and differing datasets. Pick one formula, apply it consistently, and track your own trend line. Comparing your number to someone else's published average is close to meaningless until you confirm you're both measuring the same thing.
11. Time to first response
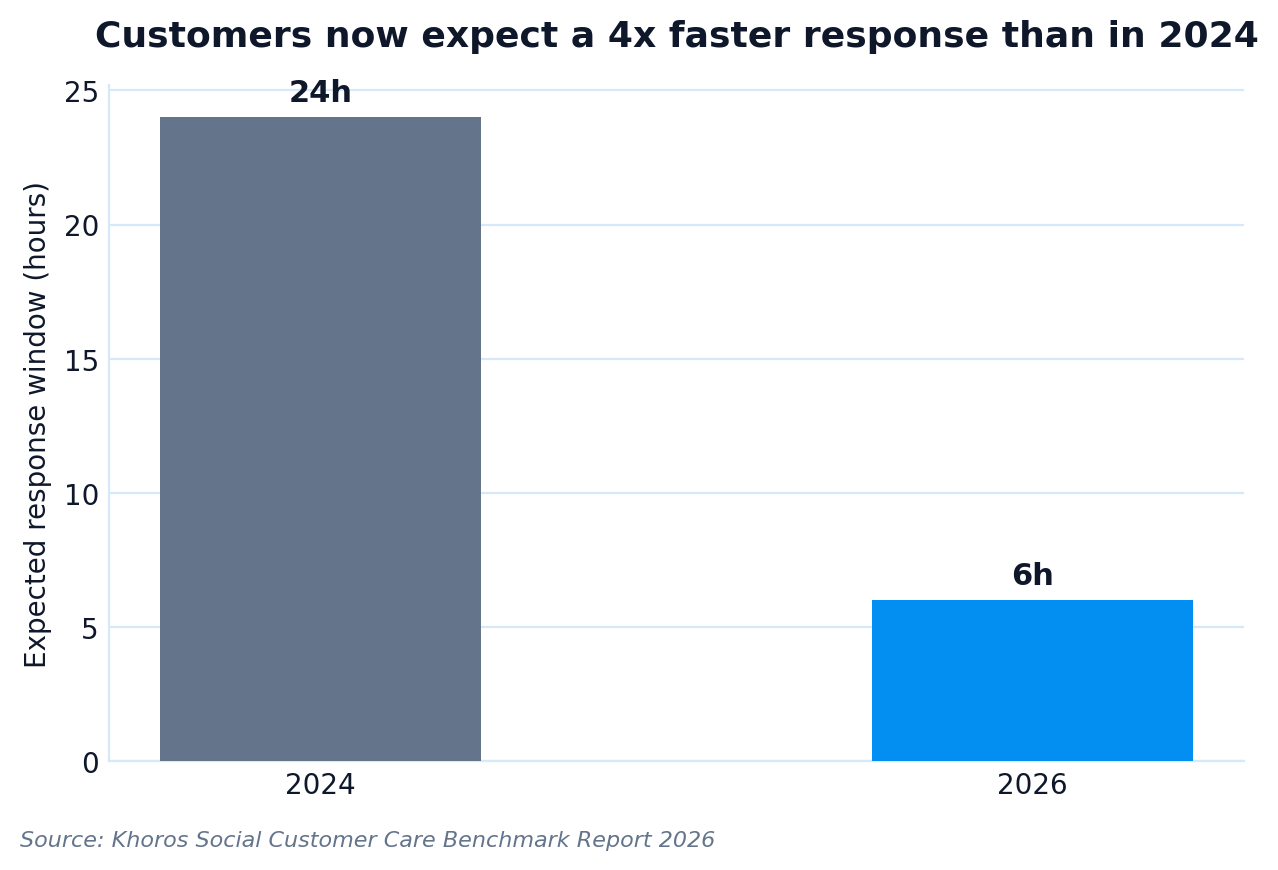
Customer expectations here have tightened sharply and keep tightening. Khoros's Social Customer Care Benchmark Report found 61% of users now expect a brand response within 6 hours, down from a 24-hour expectation as recently as 2024, and brands that miss the window see a 29% higher churn rate along with a 17% decline in positive sentiment within 30 days of an unresolved interaction, per coverage of the Khoros research. On X specifically, 53% of users expect a reply within an hour, rising to 72% when the post is a complaint.
 12. Mean time to detection (crisis)
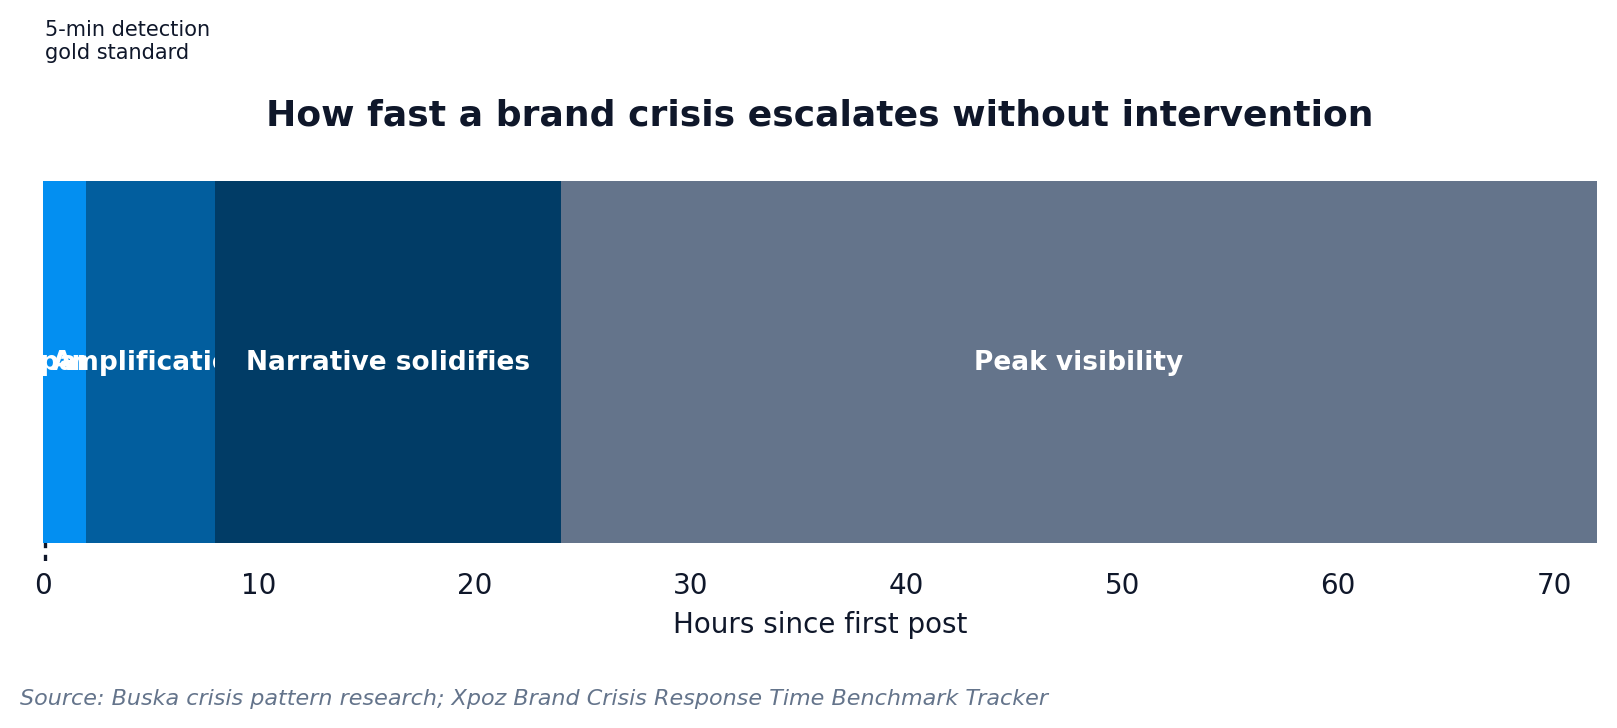
This is the metric that determines whether an incident stays a minor complaint or becomes a full crisis. Research on crisis escalation patterns, summarized by Buska, found the initial spark of a typical brand crisis happens in the first 2 hours, amplification runs from hours 2 to 8, and the narrative solidifies by hour 8 to 24 as journalists or larger accounts pick it up. Separate benchmarking from Xpoz puts the 2026 gold standard at detection within 5 minutes and an initial public response within 60 minutes, noting that brands who wait 12 or more hours retain under 15% of the trust position they'd have had with a same-hour response. The window that matters is narrower on fast platforms (4-12 hours on Twitter and Instagram) and wider on slower-moving ones (12-48 hours on Reddit and niche forums), per Konnect Insights, which also means a brand monitoring only its most visible channels is often blind to exactly the place a crisis starts.
Putting it together: a simple weekly scorecard
You don't need to report all 12 metrics with equal weight every week. A workable split looks like this:
| Cadence | Metrics | What you're watching for |
|---|---|---|
| Real-time / daily | Mention volume vs. baseline, sentiment velocity, time to detection | Spikes and early crisis signals |
| Weekly | Engagement rate (own baseline), time to first response, review reply rate | Operational consistency |
| Monthly | Share of voice, ESOV vs. share of market, AI share of voice, star rating, influence-weighted reach | Strategic position and trend direction |
The common thread across every metric that held up under research: none of them mean much as a single snapshot. Volume needs a baseline. Sentiment needs a trend line and a large enough sample. Engagement rate needs your own history, not someone else's published average. Share of voice needs a market share number to compare against. Track the rate of change and the comparison point, not just the number.
FAQ
What's the single most important social listening metric?
There isn't one that stands alone. Share of voice and excess share of voice have the strongest research link to future market share movement, and star rating has the cleanest causal link to revenue. But a team tracking only one metric is the team most likely to miss a crisis brewing on a channel it isn't watching.
How accurate is AI sentiment analysis, really?
Modern transformer-based models reach roughly 85-95% polarity accuracy on benchmark datasets, a real improvement over the 60-75% accuracy of older lexicon-based scoring. It's good enough to triage and prioritize, not good enough to report without any human review on the mentions that matter most.
Why do published engagement rate benchmarks disagree so much?
Mainly because "engagement rate" isn't one formula. Some reports calculate it against follower count, others against reach, others against impressions, and each produces a different number from identical underlying activity. That's how the same platform can show a 60x spread across different benchmark reports in the same year.
How fast should a brand respond to a potential crisis?
Detection within 5 minutes and an initial public response within 60 minutes is the standard leading benchmarks point to for 2026. The tighter constraint is usually detection, not response, since most teams only start their response clock once someone happens to notice the spike.
Does review reply rate actually affect revenue, or is that just correlation?
The Womply analysis across 200,000+ U.S. businesses found replying businesses earned meaningfully more revenue than non-repliers, which is a strong correlation at that sample size, though it isn't a controlled causal study the way the Harvard star-rating research is. Reply rate is worth tracking regardless, since it's one of the few metrics on this list your team fully controls.